By Justin Esarey
I recently had the opportunity to dip my toe in developing web applications using Shiny through R. I was first introduced to the idea by one of my former graduate students, Jane Sumner (now starting as an Assistant Professor in political methodology at the University of Minnesota). Jane developed a tool to analyze the gender balance of assigned readings using Shiny that later went viral (at least among the nerds I run with).
Elizabeth Barre (of Rice University’s Center for Teaching Excellence) had talked to me about creating an application that allows both teachers and students to figure out exactly how much out-of-class work is being expected of them. A web application would enable visitors to input information from a syllabus and obtain a workload estimate based on pedagogical research about reading and writing speeds. She did the research and much of the graphic design of the app; I wrote the back-end code, set up a hosting server, and chipped in a little on the user interface design.
The result of our efforts is available at http://cte.rice.edu/workload; clicking the link will open a new window containing the app and extensive details about how we calculate our workload estimates. Unfortunately, wordpress.com won’t let me directly embed the app on this page (although generally Shiny apps can be embedded via iframes). However, you can see what it looks like here:
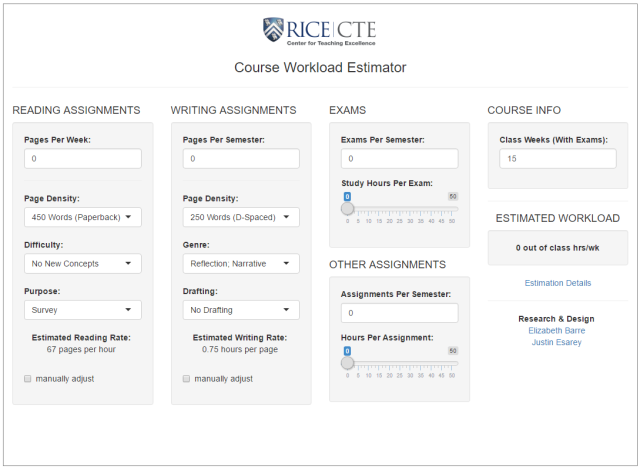
The Course Workload Estimator Tool, available at http://cte.rice.edu/workload.
The tool is interesting on its own because it illustrates just how easy it is to expect too much of our students, even our graduate students, in a three or four credit hour course (see an extended discussion of these issues on the CTE’s blog). I found that a normal graduate student syllabus can easily contain 20+ hours of out-of-class work, a substantial burden for a student taking three courses and working on his/her own research. But it was also interesting as an experiment in using R skills for web developing.
The Shiny website provides a great tutorial that can help you get started, and going through that tutorial will probably be necessary even for an experienced R programmer just because Shiny’s architecture is a little different. But I was still surprised how low the start-up costs were for me. It’s especially easy if you’re using RStudio as an IDE and hosting your application through Shiny’s service, shinyapps.io. In just a few hours, I was able to create and publish a rough-draft but working web application for testing purposes.
Things got a little rougher when I decided that I wanted to save on bandwidth costs by building my own Shiny server in the cloud and hosting my apps there. Two tutorials posted by veteran users (available here and here) helped me get started, but experience using Linux (and particularly Ubuntu) was helpful for me in understanding what was going on. Past experience became particularly relevant when I realized that the tutorials’ recipes for setting up /etc/nginx/sites-available/default were causing my server to break and I had to go through line by line to figure out what was wrong. (Eventually, I was able to sequentially modify the default file until I had the features I wanted). Still, within 3 or 4 hours, I had my own server set up and hosted on DigitalOcean, with a domain at shiny.justinesarey.com pointing to the server and the course workload app running smoothly.
In summary, I highly recommend checking out Shiny as a tool for teaching statistics and publicizing your research. It’s incredibly easy to do if you’re already experienced with programming in R and are hosting your apps through shinyapps.io.
Source code for the Course Workload Estimator tool is available here.