By Justin Esarey
A recent analysis produced by Conor Sen has been going ’round the blogosphere, most prominently in the Atlantic Monthly.
https://twitter.com/conorsen/status/383578153202900992
The chart shows the relationship between a Congressional district’s population density (on the y-axis) against the Cook Partisan Voting Index.
What’s interesting to me is that trend line in there, and the interpretation that comes out of it. As Emily Badger of the Atlantic says:
But you may also be struck by the shape of that trend line (Sen is quick to note, by the way, that he’s not a statistician). It roughly suggests a political tipping point somewhere around a population density of about 800-1,000 people per square mile.
Huh. Well, that did not look like a very good fit to me. So, I reconstructed the data set using the Wikipedia-sourced PVI data and the Census-sourced population density data that Conor talked about:
https://twitter.com/conorsen/status/383613924219682816
https://twitter.com/conorsen/status/383614185369649153
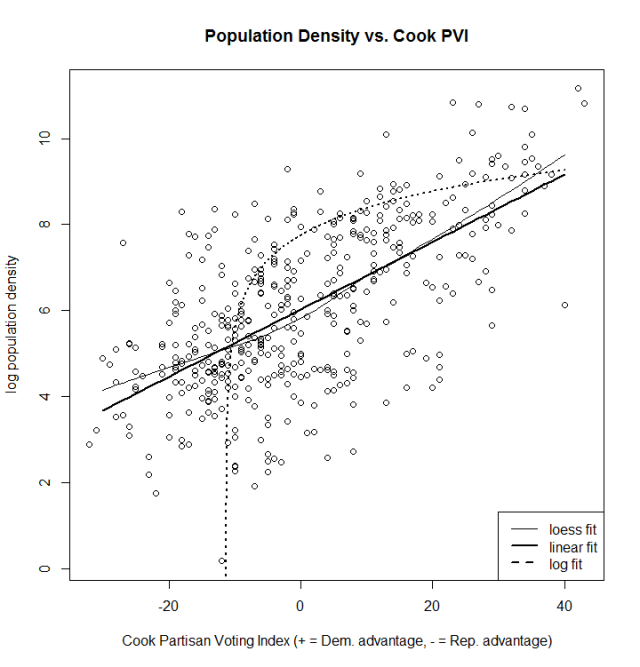
I then ran an analysis of this data replicating Conor’s log-fitted model, plus a loess nonparametric fit line and a simple linear model. Here’s what these three models look like when plotted against one another:
As you can see, the nonparametric loess model doesn’t indicate any sort of tipping point in the relationship between PVI and population density. Indeed, the loess fit is quite close to a simple linear model. And fit statistics indicate that the linear model fits the data far better: for example, the Akaike Information Criterion for the linear model is 1559.752, compared to 8794.918 for the log-fit model.
Now, the logarithmic transformation of the population data does build in the idea that increases in the Cook PVI are associated with exponentially increasing population densities. Another way of saying this is that increasing population density is associated with marginally declining increases in Democratic partisanship. But that’s different than arguing for a “tipping point” for population density above which districts somewhat suddenly become Democratic.
All data and code for my analysis can be found here.

