By Alexander Meyer and Leah R. Rosenzweig (Department of Political Science, Massachusetts Institute of Technology, Cambridge, MA 02139. lrosenzw@mit.edu, corresponding author.)*
1 Introduction
Conjoint analysis has long been used in marketing research, but has recently become popular in political science. Originally developed by Luce and Tukey in 1964, conjoint analysis serves as a useful tool for understanding preferences over multidimensional alternatives. This method presents respondents with profiles — for example of candidates (Carlson, 2015; Rosenzweig and Tsai, N.d.) or immigrants (Hainmueller and Hopkins, 2014; Berinsky et al., 2015) — that have randomly assigned attributes and asks respondents to evaluate and choose between them. The random assignment of profile characteristics allows researchers to identify the causal influence of attributes on a person’s decision to vote for a candidate or allow an immigrant into the country.[1]
Conjoint analysis is advantageous for researchers interested in observing respondents’ choice-making behaviors and attitudes. Using this method, researchers can identify interaction effects as well as analyze particular aspects of treatments. For example, not only can it be used to identify the effect of a candidate’s past performance on the probability that respondents will vote for her, but we can also analyze the influence of past performance with respect to the candidate’s ethnic identity (Carlson, 2015). In addition, conjoint analysis allows us to investigate subgroup effects based on shared attributes between profiles and respondents, which can influence respondent attitudes (Berinsky et al., 2015). Thus, we are able to implement more realistic ‘bundled’ treatments, testing multiple hypotheses simultaneously (Hainmueller, Hopkins and Yamamoto, 2014).
As with all survey experiments, external validity is always a concern. Hainmueller, Hangartner and Yamamoto (2015) test the external validity of conjoint analysis by comparing results to a real-world behavioral benchmark in Switzerland. The authors find strong evidence that conjoint experiments can help to explain the preferences and behaviors of people in the real-world. From a paired conjoint design “estimates are within 2% percentage points of the effects in the behavioral benchmark” (Hainmueller, Hangartner and Yamamoto, 2015, p. 2395). Not only is conjoint analysis useful for investigating multiple hypotheses at once, but it can also achieve reliable results.
Until very recently, conjoint analysis had been relegated to online surveys. However, this method presents an excellent opportunity for researchers to understand preferences and behaviors across a host of different contexts. Researchers have begun to take advantage of this method in developing countries (Carlson, 2015; Hartman and Morse, 2015) but lack widely available resources for easy implementation and standardized best practices. Here we present the tools we developed to help researchers conduct conjoint experiments offline among respondents with little or no education.
2 Application Areas
As described above, conjoint analysis is a useful technique for a variety of settings and questions. The tools that we present here allow researchers to easily apply this method in conditions where surveys are conducted in-person, offline, and respondents have low levels of education or are illiterate. We believe these tools will prove useful for researchers wishing to conduct conjoint experiments in settings such as these–mainly developing countries.
In many developing countries it is difficult to conduct surveys online. The commonly used companies that recruit online samples in the US and other developed nations, such as YouGov, SSI and Mturk, do not yet operate in many developing countries. Part of the problem may be that our target respondents are not yet online. While 82.2% of individuals in developed countries use the internet, only 35.3% of individuals in developing countries do.[2] Although Facebook is becoming a valuable resource for recruiting online samples in developing countries (Rosenzweig and Tsai, 2016), there is not yet a reliable, convenient and low-cost way to obtain a representative sample online in many countries that we wish to study. Therefore, in many cases recruiting respondents requires traveling to find them at home. Sometimes respondents reside in rural villages that are disconnected from data networks. In 2015, only 29% of the world’s rural population had 3G coverage.[3] In these instances the existing tools (Hainmueller, Hopkins and Yamamoto, 2014) to set up a conjoint design will not work.
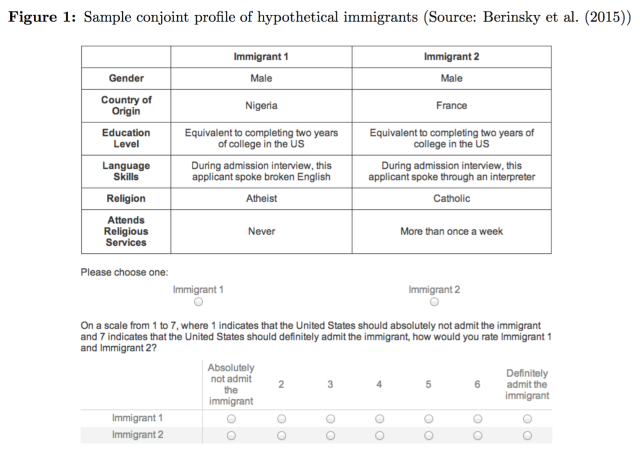
Another instance in which the tools we present apply is conducting conjoint experiments with less educated or illiterate respondents. Generally, conjoint profiles look akin to Figure 1. To present conjoint profiles in an intelligible way for many respondents we must abandon the practice of using text. Translating the text into the local language is insufficient in environments where respondents are illiterate or have not received years of education and are unaccustomed to engaging in these types of cognitive tasks. We would moreover advise against relying on enumerators to present the information verbally and respondents retaining this information without the aid of visual cues. As others have done before us (Hartman and Morse, 2015), we propose using images to represent profile characteristics. The tools we developed address each of these instances–working with survey software offline and creating conjoint profiles in image form.
3 The Resources
To contribute to the community of researchers wishing to conduct these experiments in similar contexts we have developed tools and made them open source and available for immediate use. The first of these resources is JavaScript code that works in conjunction with the Qualtrics offline application to store attribute variables and randomly assign those variables without relying on a web scripts source. The second tool is an application that allows users to assign images or text to attribute levels.[4] The application produces randomized conjoint profiles with these images in a PDF. Each PDF has a unique ID, and a csv file recording the attribute-levels presented in every round of each PDF. In this section we describe these resources in greater detail.
3.1 Conjoint Offline
This resource is appropriate for use in the instances described above, where internet access is unreliable and standard tools cannot be used. The code we developed allows you to customize a conjoint design for offline use. In the instructions, we explain how to integrate the code for use with the Qualtrics offline application. Following standard practices, the code randomizes the order of the attributes once for every respondent. In each round the attribute-levels are randomly assigned. This tool presents conjoint profiles in text form. We recommend using this tool on a tablet or other mobile device. In some rare cases, with a literate and highly educated sample, respondents may be able to view the text profile tables on the tablets directly and then respond. In most cases, where respondents are less educated, enumerators will need to read the randomized conjoint profiles on the tablet and then use visual aids to present the profiles in image form to respondents. In either case, researchers need not rely on enumerators to implement the randomization themselves. This code can also be adapted for other offline survey applications that are JavaScript compatible. In a following section we illustrate how this tool was used in rural Tanzania.
3.2 Conjoint with Images
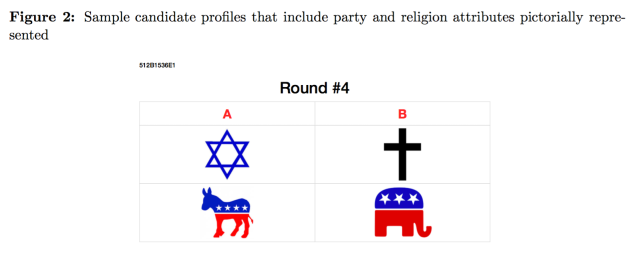
The second tool we developed is open source code that builds an app which generates conjoint profiles using images (or text) to represent attribute-levels.[5] After uploading the desired images, designating the number of rounds, and names of choices, it produces PDFs that have two profiles per round. These profiles are comprised of randomly assigned attribute-levels in image form. These PDFs are for use in one-on-one surveys with respondents. The PDF packets produce unique IDs for each conjoint packet and are printed on each page. The profile data (attribute-levels) presented in each round are stored in a csv file that can be downloaded from the application. We recommend using these profiles on paper with respondents and easily connecting them to the stored data from the application and other survey questions recorded in tablets with the unique IDs. Figure 2 provides an example of one round of conjoint profiles. In the next section we describe common challenges to implementing conjoint experiments in developing countries and illustrate, using an example from Tanzania, how to overcome these challenges with the tools we created.
4 Challenges of Conjoint: Evidence from Tanzania
In this section we describe some common challenges to implementing conjoint experiments in developing countries. We illustrate how the tools we created helped to overcome these problems for a conjoint experiment in Tanzania.
4.1 Randomizing conjoint profiles without an internet connection
In many developing countries cell network is sparse and data coverage rare. In these cases implementing a conjoint experiment using resources that require an internet connection is infeasible. However, researchers often want to collect data electronically, and therefore require a way to create randomized conjoint profiles and store these data electronically without the use of web-scripts.
Following standard practice for creating conjoint profiles, the order of the attributes should be randomized for each respondent and the levels of each attribute randomly assigned each round (Hainmueller, Hopkins and Yamamoto, 2014). Relying on enumerators to randomize conjoint profiles in this way and trusting that they record the correct attributes shown is risky and cumbersome. The tool we developed works in conjunction with the Qualtrics offline app to randomize the order of the attributes and each attribute-level, and stores these variables in the data that can be downloaded from the Qualtrics site. This tool makes implementing conjoint experiments and data collection on tablets or other hand-held devices without an internet connection feasible.
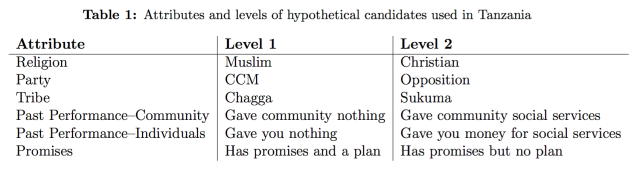
Just prior to the October 2015 general elections in Tanzania, Rosenzweig and Tsai, in collaboration with Twaweza, ran a conjoint experiment in 82 rural villages. The researchers wanted to know what candidate attributes influence the probability that voters will support that candidate? “The hypothetical candidate profiles varied on the basis of six attributes: religion, party, tribe, past performance towards the community, past performance towards individuals, and credibility of promises. Each of the six attributes are binary and take on one of two values” (see Table 1) (Rosenzweig and Tsai, N.d.).
Using our tool with the Qualtrics offline app, the researchers in Tanzania were able to create randomized candidate profiles on tablets. “In one treatment condition in Tanzania the enumerator conducted a conjoint experiment with a group of five participants simultaneously. The enumerator sees the randomized conjoint profiles, in text form, on the tablet and then presents laminated index cards, with images to represent the candidate attributes, to the group. The enumerator uses these visual aids to tell the story of each candidate and presents the choice task as a ‘game’. By referencing specific features of the images the respondents are better able to remember what each picture represents. The enumerator uses the tablet to record how each participant voted using the numeric ID tags participants wear. The tool records the profiles the group saw and any other variables included in the survey. Each night, back at the hotel, the supervisor sets up a wifi hotspot and uploads the data from the tablets to the server” (Rosenzweig and Tsai, N.d.).
4.2 Self-administered surveys with illiterate respondents
In general, self-administered surveys are difficult to conduct in developing countries for several reasons, including low levels of education. When we want surveys to mirror the real- world processes and behaviors they are trying to predict, we need respondents to answer questions in private. In the case of voting, ideally respondents should use secret ballots instead of reporting their answers directly to enumerators, since enumerators can affect responses (Adida et al., 2014) and social desirability bias is a constant concern.
In Tanzania approximately 32% of the population is illiterate.[6] “Of the sampled survey respondents 6% had no formal schooling, 8% had only some primary school education, and 62% finished primary school but did not pursue further education” (Rosenzweig and Tsai, N.d.). Although it was impractical to have respondents self-administer the entire survey in Tanzania, the researchers were able to have respondents record their voting preferences in the conjoint experiment in secret using the tools we created.
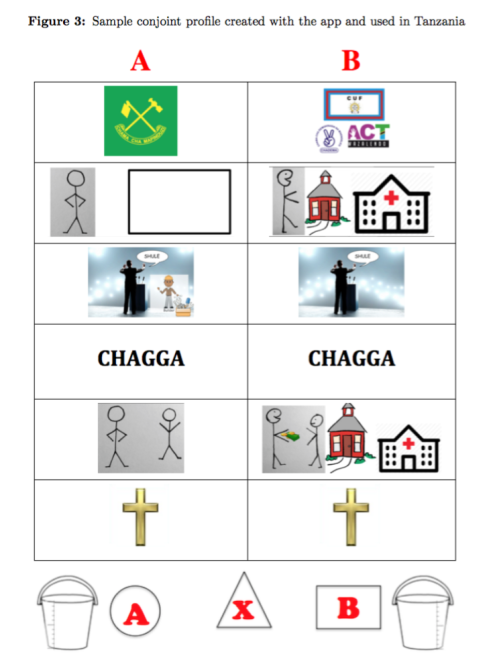
Using the tool that produces conjoint profiles using images to represent attributes, respondents were able to use paper and pen to record their voting decisions in secret.[7] After presenting the candidate profiles and explaining how to fill out the ballot to the respondent, the enumerator leaves the room while the respondent votes by circling their preferred candidate (“A” or “B”), or “X” if they want to abstain.
In addition to measuring if respondents voted and for which candidate, respondents were also asked to rate both candidates. Instead of the traditional feeling thermometers and Likert scales that prove confusing for innumerate respondents, the researchers developed a ‘bucket scale’ measure. “Respondents indicate how much water they would fill a bucket with to represent how well they think the candidate would be at getting things done if elected. Respondents are instructed on this measure and then asked to draw their water line before putting their secret ballots in the envelop” (Rosenzweig and Tsai, N.d.).[8] Obtaining multiple measures of voting preferences in these contexts allows researchers to verify respondent comprehension with the task.
The tool we created allows researchers to easily combine survey data collected with the tablet and the conjoint voting responses written on paper. The app produces a unique packet ID and round number on each sheet of paper, making it easy to connect respondents’ secret ballot responses, with pre-populated conjoint profiles produced by the app and survey questions recorded in the tablet.[9] The enumerator can also honestly tell the respondent that they will never know how they vote since the data entry of voting responses and data analysis is conducted by the researcher, using the packet ID as a unique identifier.
5 Conclusion
Conjoint analysis is gaining popularity in the social sciences and being applied in a variety of contexts. We propose that many of these contexts require adaptation of the standard tools used to implement conjoint experiments. We provide two such tools that allow researchers to design a conjoint choice task using offline survey software and a tool that allows easy randomization and presentation of conjoint profiles using images to represent attribute-levels.
Appendix
Note: All code / files referred to in this publication are available at: http://dx.doi.org/10.7910/DVN/DURDD3.
Endnotes
*We would like to thank Lily L. Tsai and Teppei Yamamoto for their helpful comments and suggestions.
- See Hainmueller, Hopkins and Yamamoto (2014) for an analytical discussion of estimation techniques.
- ICT Facts and Figures 2015
- ICT Facts and Figures 2015
- A hosted app is ready for immediate use on the MIT GOV/LAB website and all code/files referred to in this publication are available at: Meyer and Rosenzweig (2016) http://dx.doi.org/10.7910/DVN/DURDD3.
- The app can also produce conjoint profiles with text that are easily printed, if that is desired.
- Unicef 2013.
- The researchers tested using the tablet to record respondent votes but found that this did not work well. Respondents were confused by and often suspicious of the tablets—they even thought the tablets were being used to capture their fingerprints so that they would not be able to vote in the upcoming general election. This is likely context specific, since Tanzania had just introduced a new biometric voter registration system using fingerprints, but something of which to be wary.
- See Figure 3 in the Appendix for an example of the secret ballot used.
- Enumerators record the packet ID in the tablet before the beginning of the survey.
References
Adida, Claire, Karen Ferree, Daniel Posner and Amanda Robinson. 2014. “Who’s asking? Interviewer coethnicity effects in African survey data.” Unpublished Manuscript .
Berinsky, Adam, Tesalia Rizzo, Leah R. Rosenzweig and Elisha Heaps. 2015. “Attribute Affinity: US Natives’ Attitudes Toward Immigrants.”.
Carlson, Elizabeth. 2015. “Ethnic Voting and Accountability in Africa: A Choice Experiment in Uganda.” World Politics 67(02):353–385.
Hainmueller, Jens and Daniel J Hopkins. 2014. “The hidden american immigration consensus: A conjoint analysis of attitudes toward immigrants.” American Journal of Political Science .
Hainmueller, Jens, Daniel J Hopkins and Teppei Yamamoto. 2014. “Causal inference in conjoint analysis: Understanding multidimensional choices via stated preference experiments.” Political Analysis 22(1):1–30.
Hainmueller, Jens, Dominik Hangartner and Teppei Yamamoto. 2015. “Validating vignette and conjoint survey experiments against real-world behavior.” Proceedings of the National Academy of Sciences 112(8):2395–2400.
Hartman, Alexandra and Ben Morse. 2015. “Wartime Violence, Empathy, and Inter-group Altruism: Theory and Evidence from the Ivoirian Refugee Crisis in Liberia.”.
Horiuchi, Yusaku, Daniel M Smith and Teppei Yamamoto. 2015. “Identifying Multidimensional Policy Preferences of Voters in Representative Democracies: A Conjoint Field Experiment in Japan.” Available at SSRN 2627907 .
Meyer, Alexander, Leah R.Rosenzweig. 2016. “Replication Data for: Conjoint Analysis Tools for Developing Country Contexts.” http://dx.doi.org/10.7910/DVN/DURDD3. Harvard Dataverse, V1.
Rosenzweig, Leah and Lily L. Tsai. 2016. “Using Facebook for Online Experiments.”.
Rosenzweig, Leah and Lily L. Tsai. N.d. “Evaluating Candidates: A Conjoint Experiment in Tanzania.”.